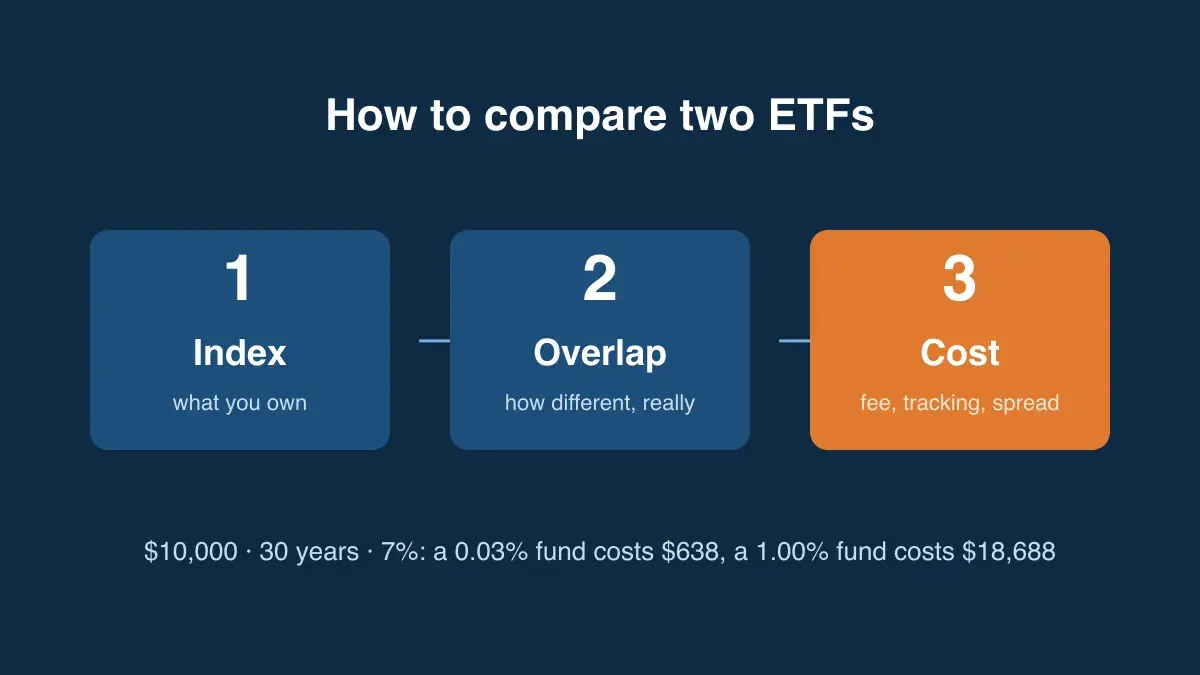
Compare the index each fund tracks before anything else. If two ETFs track the same index they are near-substitutes, and the decision comes down to cost, trading and tax. If they track different indexes they are different bets, and no expense ratio tells you which one will do better. Most bad ETF comparisons get this order backwards: they rank funds on fees or last year’s return when the funds were never doing the same job.
Step 1: the index decides what you own
An index fund’s return is its index’s return minus costs and minus a small tracking error. So the index is not one attribute among many — it is the investment. VOO, IVV and SPY all track the S&P 500; their returns differ by fractions of a percent a year, and comparing them is a cost exercise. VOO and QQQ track different indexes; comparing their fees tells you almost nothing about which to own. You can see this in any same-index pair next to a different-index pair.
Two questions settle step one. Same index, or not? If not, which index do I actually want — large companies only, the whole market, one sector, dividend payers, another country? That is an allocation decision, and it is yours to make before any fund comparison starts.
Step 2: overlap, when the indexes differ
Different indexes can still hold mostly the same companies. A large-cap index and a total-market index share their biggest names, because the total market is mostly large companies by weight. Overlap tells you how different two funds really are.
The calculation: for each security both funds hold, take the smaller of its two weights, then add them up.
| Holding | Fund X weight | Fund Y weight | Counts toward overlap |
|---|---|---|---|
| A | 7% | 12% | 7% |
| B | 6% | 10% | 6% |
| C | 5% | — | 0% |
| D | 4% | — | 0% |
| E | — | 8% | 0% |
| Total | 13% |
Use the full holdings files each issuer publishes, not the top-ten list. Two broad funds usually agree at the top and differ in the long tail, so a top-ten comparison makes them look more alike than they are. High overlap means owning both adds little; that is the question behind how many ETFs you should own.
Step 3: cost, which is everything when the index is the same
Once two funds track the same index, cost is most of the remaining difference. The expense ratio is charged every year on the whole balance, so it compounds. Here is $10,000 at an assumed 7% a year before fees:
| Expense ratio | After 10 years | Cost vs no fee | After 30 years | Cost vs no fee |
|---|---|---|---|---|
| none | $19,672 | — | $76,123 | — |
| 0.03% | $19,616 | $55 | $75,485 | $638 |
| 0.10% | $19,488 | $183 | $74,017 | $2,106 |
| 0.20% | $19,307 | $365 | $71,968 | $4,155 |
| 0.50% | $18,771 | $900 | $66,144 | $9,979 |
| 1.00% | $17,908 | $1,763 | $57,435 | $18,688 |
Read the table in two directions. Between two cheap index funds, a few hundredths of a percent is worth knowing but rarely worth switching for, since selling in a taxable account can cost more than decades of fee difference. Between a cheap fund and a 1% fund, the fee takes about a quarter of the ending balance. The full curve is in fee drag by expense ratio, and how the fee is actually taken is in how an expense ratio is charged.
Two costs do not appear in the expense ratio:
- Tracking difference. The gap between the fund’s return and its index’s return over a full year. It folds in the fee, securities-lending income and trading costs, so it is a better measure of what you actually paid than the headline ratio. Compare it over several years, on the fund’s own performance page.
- The bid-ask spread. You pay roughly the full spread on a round trip: about $1 on $10,000 at a 0.01% spread, $10 at 0.10%, $50 at 0.50%. SEC Rule 6c-11 requires most U.S. ETFs to publish their median 30-day spread on their own website, so you don’t need to estimate it. It matters for frequent traders and small, thinly traded funds. For a buy-and-hold investor in a large fund it is close to zero.
Step 4: tax and structure, the tiebreakers
In a taxable account, check how each fund’s distributions are taxed and whether it has a history of paying capital-gains distributions. Most equity ETFs rarely do, which is why ETFs are more tax-efficient than most mutual funds. Some categories are taxed differently: physically backed gold funds, for example, are taxed as collectibles (see gold ETF vs physical gold). Fund size matters at the extremes, because a very small fund is more likely to close, and a closure is a forced sale on someone else’s schedule (see what happens when an ETF closes). Past a certain size, though, more assets don’t make a fund better.
Four numbers that look decisive and aren’t
- Share price. A $50 share and a $500 share on the same index give you identical exposure per dollar. Price is how the fund is sliced, not what it costs.
- Last year’s return. Between same-index funds it should be nearly identical, so the only useful thing it shows is tracking. Between different-index funds it mostly tells you which sector led that year.
- Dividend yield on its own. Yield is the cash part of the return. Compare total return after tax; a high yield can come from slower-growing holdings, option selling, or returning your own capital. See SCHD vs JEPI for two funds that produce income in very different ways.
- Number of holdings. 500 holdings and 3,500 holdings can produce nearly the same return when the extra 3,000 names are a small share of the weight. Weight matters more than count, which is why overlap is the useful measure.
The checklist
- Same index? If yes, skip to step 3.
- If not, decide which index you want, then measure overlap with the full holdings.
- Compare expense ratio and multi-year tracking difference.
- Check the published median spread if you trade often or the fund is small.
- In a taxable account, check distribution history and tax treatment.
To run the side-by-side quickly, FundDuel’s ETF comparison tool puts expense ratio, holdings, yield, benchmark and top holdings for two funds on one page.
Frequently asked
What is the most important thing to compare between two ETFs?
The index each one tracks. Everything else is downstream of it. Two funds that track the same index hold almost the same securities in almost the same weights, so they will deliver almost the same return before costs, and the comparison collapses into cost, trading and tax details. Two funds that track different indexes are different investments, and no fee difference between them tells you which will do better. Read the benchmark line on each fund's page before you look at a single other number.
How much does an expense ratio difference actually cost?
On $10,000 growing at 7% a year for 30 years, with no fee it reaches $76,123. A 0.03% expense ratio leaves $75,485 (a cost of $638), 0.10% leaves $74,017 ($2,106), 0.20% leaves $71,968 ($4,155), 0.50% leaves $66,144 ($9,979), and 1.00% leaves $57,435 ($18,688). Over 10 years the same fees cost $55, $183, $365, $900 and $1,763. The gap between two cheap index funds is small; the gap between a cheap fund and a 1% fund is about a quarter of the ending balance. These figures are arithmetic on an assumed return, not a forecast.
How do you calculate the overlap between two ETFs?
For every security the two funds both hold, take the smaller of its two weights, then add those numbers up. If fund X holds A at 7% and B at 6%, and fund Y holds A at 12% and B at 10%, the overlap is 7% + 6% = 13% from those two names. Securities only one fund holds add nothing. The result is the share of your money that would sit in the same companies whichever fund you bought. Use full holdings files, not top-ten lists, because the tail is where two broad funds differ most.
Where do I find an ETF's bid-ask spread?
On the fund's own website. SEC Rule 6c-11, which most U.S. ETFs operate under, requires the fund to publish its median bid-ask spread over the last 30 days, along with its NAV, market price and premium or discount, on a public website. You pay roughly the full spread on a round trip, buying at the ask and selling at the bid: at 0.01% that is about $1 on $10,000, at 0.10% about $10, at 0.50% about $50. It matters most for frequent traders and thinly traded funds.
Does a lower share price make an ETF cheaper?
No. Share price is just how the fund's assets are sliced, and it says nothing about cost or value. A fund at $50 a share and a fund at $500 a share holding the same index give you the same exposure per dollar invested. Most brokers sell fractional shares, so even the minimum-purchase argument has mostly gone. Compare expense ratios and tracking, never price per share.
Should I compare ETFs by past returns?
Only to check tracking, never to pick a winner. For two funds on the same index, returns should be nearly identical, and the size of the gap tells you how well each one tracks. For two funds on different indexes, a past-return gap tells you which index happened to do better in that window — usually a statement about which sector led, not about either fund's quality. A one-year return is the least informative number on most fund pages.
Is a fund's dividend yield a good way to compare ETFs?
Not on its own. Yield is the cash part of the return; what you keep is total return after tax. A fund can show a high yield by holding slower-growing companies, by selling options, or by returning your own capital, and each of those has a cost that does not appear in the yield figure. Compare total return for funds with the same objective, and check how the distributions are taxed in the account you will hold the fund in.
The fee and spread figures on this page are arithmetic on stated assumptions ($10,000, 7% a year before fees, annual compounding), computed for this article and reproducible in a few lines of code. They are not the observed return of any real fund and not a forecast. The overlap table uses hypothetical funds X and Y to show the method. The disclosure requirements referred to are those of SEC Rule 6c-11 (17 CFR 270.6c-11). General information about how to compare funds, not investment advice.